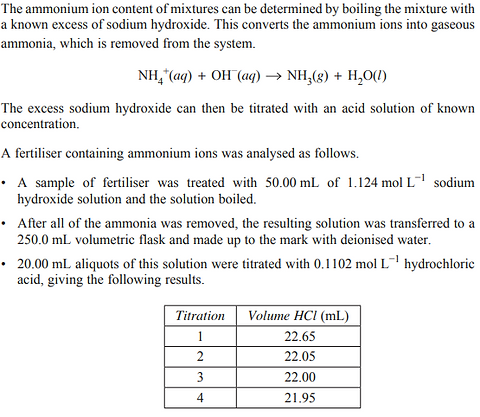
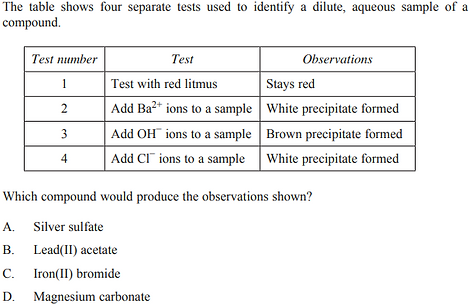
2019 - Q19
A quantity of silver nitrate is added to 250.0 mL of 0.100 mol L−1 potassium sulfate at 298 K in order to produce a precipitate.
Silver nitrate has a molar mass of 169.9 g mol–1.
What mass of silver nitrate will cause precipitation to start?
A. 0.00510 g
B. 0.186 g
C. 0.465 g
D. 0.854 g
2019 - Q20
What was the percentage by mass of manganese in the steel sample?
A. 0.019%
B. 0.096%
C. 0.48%
D. 1.0%

Which ion can be detected using a precipitation reaction with silver nitrate? A. Ag+
B. Cl–
C. Mg2+
D. NO3 −
2021 - Q1
2019 - Q29 (11 marks)
Stormwater from a mine site has been found to be contaminated with copper(II) and lead(II) ions. The required discharge limit is 1.0 mg L–1 for each metal ion. Treatment of the stormwater with Ca(OH)2 solid to remove the metal ions is recommended.
(a) Explain the recommended treatment with reference to solubility. Include a relevant chemical equation. (2 marks)
(b) Explain why atomic absorption spectroscopy can be used to determine the concentrations of Cu2+ and Pb2+ ions in a solution containing both species. (2 marks)
(c) The data below were obtained after treatment of the stormwater.
To what extent is the treatment effective in meeting the required discharge limit of 1.0 mg L–1 for each metal ion? Support your conclusion with calibration curves and calculations.


2021 - Q9

2020 - Q22 (5 marks)
A 0.1 mol L−1 solution of an unknown salt is to be analysed. The cation is one of magnesium, calcium or barium. The anion is one of chloride, acetate or hydroxide.
Outline a sequence of tests that could be performed in a school laboratory to confirm the identity of this salt solution. Include expected observations and a balanced chemical equation in your answer.
2020 - Q31 (4 marks)
A water sample was analysed to determine the chloride ion content.
100.0 mL of this water was added to 25.00 mL of 0.100 mol L−1 AgNO3 (aq).
The mixture was filtered and the filtrate was titrated against 0.0500 mol L−1 KSCN(aq) according to the following reaction.
Ag+(aq) + SCN−(aq) --> AgSCN(s)
The titration was repeated three times and the average titre was 28.65 mL. Calculate the concentration of chloride ions in the water, expressed in mg L−1.
2021 - Q28 (4 marks)
A 5.30 g sample of an alkali metal hydroxide was dissolved in water. After mixing with excess Cu(NO3)2, the precipitate was collected, dried, measured and found to have a mass of 4.61 g.
Identify the alkali metal hydroxide. Support your answer with calculations and a balanced equation.
2021 - Q14
A sample of nickel was dissolved in nitric acid to produce a solution with a volume of 50.00 mL. 10.00 mL of this solution was then diluted to 250.0 mL. This solution was subjected to colorimetric analysis. A calibration curve for this analysis is given.
The solution gave an absorbance value of 0.30.
What was the mass of the sample of nickel?
A. 0.0021 g
B. 0.031 g
C. 0.053 g
D. 0.15 g

2021 - Q30 (5 marks)
A student was trying to identify the ions present in a dilute aqueous solution.
The solution contained ions of barium, calcium or magnesium, and ions of hydroxide or acetate.
The student performed the following tests and recorded their observations. A fresh sample of the solution was used for each test.
• When aqueous sodium chloride was added, no visible reaction was observed.
• When aqueous silver nitrate was added, brown precipitate was produced. The precipitate dissolved when dilute hydrochloric acid was added.
• When concentrated aqueous sodium sulfate was added, white precipitate was produced.
Evaluate this procedure as a method of identifying the ions.
2022 - Q28 (5 marks)
The iron content of an impure sample (4.32 g) was determined by the process shown in the flow chart.
(a) Identify the brown precipitate formed at the end of step 3. (1 mark)
(b) Calculate the percentage of iron in the original impure sample if 4.21 g of iron(III) oxide (Fe2O3) was collected. Assume that all the iron was converted to iron(III) oxide. (4 marks)


2021 - Q17
2022 - Q4
An analytical chemist was using atomic absorption spectroscopy (AAS) to determine the manganese concentration in a sample.
The following diagram shows the absorbance lines of manganese.
The diagrams below show the emission spectra of four AAS lamps.
Which lamp should be used to determine the manganese concentration in the sample?


2023 - Q30 (4 marks)

2023 - Q32 (5 marks)

2022 - Q5
Which pair of ions can be distinguished using a flame test in the school laboratory?
A. Ag+ and Mg2+
B. Ba2+ and Ca2+
C. Br− and Cl−
D. Fe2+ and Fe3+
2022 - Q6
A UV-visible spectrometer was used to obtain the spectra of solutions of substances P and Q. The absorbance spectra are shown.
Which wavelength would be appropriate to determine the concentration of Q in a mixture of the two solutions?
A. 410 nm
B. 475 nm
C. 550 nm
D. 630 nm

2022 - Q16
A blue solution of copper(II) sulfate was investigated using colourimetry. Orange light (wavelength = 630 nm) was used and the pathlength was 1.00 cm.
Which change would result in a higher absorbance value?
A. Diluting the solution
B. Using a higher intensity lamp
C. Using blue light (wavelength = 450 nm)
D. Setting the pathlength to 2.00 cm
2023 - Q2
The technique illustrated is used to analyse chemical substances in a sample.
What is the technique shown?
A. Flame test
B. Mass spectrometry
C. Atomic absorption spectroscopy
D. Ultraviolet-visible spectrophotometry

2023 - Q13
