Barker College Chemistry Department
Past HSC Chemistry Questions
Please click the following link for the past papers of the new syllabus: HOME | Past Hsc Chem3 (andrewchoi2.wixsite.com)
2001 - Q12
The atomic absorption spectrophotometer was developed by Sir Alan Walsh and his team at CSIRO in the 1950's. Its development was one of the most significant in Australiam chemical technology. What did it provide?
(A) A rapid method to monitor chemical pollutants in water supplies
(B) The first method for determining the concentrations of metal ions in water supplies
(C) A method for determining the concentrations of hydrocarbons at very low concentrations
(D) A method for determining the concentrations of metal ions at very low concentrations
2001 - Q13
Four students analysed a sample of fertiliser to determine its percentage of sulfate.
Each student:
-
weighed an amount of fertiliser;
-
dissolved this amount in 100 mL of water;
-
added aqueous barium nitrate;
-
filtered, dried and weighed the barium sulfate precipitate.
Their results and calculations are shown in the table.
The percentage of sulfate calculated by Student C was significantly higher than that of the other students.
Which is the most likely reason for this?
(A) Student C did not dry the sample for long enough
(B) Student C added more barium nitrate solution than the other students
(C) Student C used a balance capable of measuring weight to more decimal places
(D) Student C waited longer than the other students for the barium nitrate to react completely with the sulfate.

2001 - Q15
Four students were asked to test a solution for the presence of a cation by using various anions. The students obtained these results:
Each students concluded that lead ions was present.
Which student had results consistent with this conclusion?
(A) A
(B) B
(C) C
(D) D

2002 - Q15
The table gives the results of chemical tests for some cations and anions. (ppt = precipitate)
When a group of students performed the above tests on an unknown solution they obtained the following results:
Which conclusion is consistent with these results?
(A) The sample contained both CaCl2 and BaCl2
(B) The sample contained both CaCl2 and PbCl2
(C) The sample contained both FeCl3 and PbCl2
(D) The sample contained both FeCl3 and BaCl2


2004 - Q3
Which of the following cations can be identified using a flame test?
(A) Al3+
(B) Cu2+
(C) Mg2+
(D) Zn2+
2005 - Q11
Which of the following substances is best analysed by atomic absorption spectroscopy (AAS)?
(A) Calcium
(B) Iodine
(C) Nitrogen
(D) Silicon
2006 - Q14
A scientist used atomic absorption spectroscopy (AAS) to analyse the concentration of iron in a sample of water. The scientist analysed the sample five times and obtained the absorbances shown in the table.
Analysis Absorbance
1 0.390
2 0.392
3 0.249
4 0.387
5 0.394
The scientist needed an average absorbance to determine the concentration of iron from a calibration curve.
Which value should the scientist use?
(A) 0.362
(B) 0.3624
(C) 0.39075
(D) 0.391
2007 - Q14
Which statement about Atomic Absorption Spectroscopy (AAS) is correct?
(A) AAS is an effective qualitative technique but it cannot be used for quantitative analysis.
(B) AAS measures the wavelengths of light emitted when electrons fall back to their ground state.
(C) In AAS, white light is shone through a vaporised sample in order to observe which wavelengths are absorbed.
(D) The wavelength of light used in AAS matches one of the spectral lines produced when the sample is analysed by a flame test.
2008 - Q15
A 2.45 g sample of lawn fertiliser was analysed for its sulfate content. After filtration and drying, 2.18 g of barium sulfate was recovered. What is the % w/w of sulfate in the lawn fertiliser?
(A) 16.8
(B) 36.6
(C) 46.2
(D) 89.0
2009 - Q4
What flame colour is produced by barium ions in a flame test?
(A) Red
(B) Blue
(C) Green
(D) Orange
2009 - Q8
Three separate colourless solutions each contain one cation, Na+ , Pb 2+ or Ca 2+ . Which of the following would be an appropriate reagent to unambiguously identify the solution containing Pb 2+ ?
(A) KI
(B) K2CO3
(C) K3PO4
(D) AgNO3
2010 - Q10
A sample of water from a stream, suspected to be contaminated with metal ions, was analysed. The results of some tests on the water are recorded in the table.
Test Result
Add dilute HCl No change
Add Na2SO4 solution White precipitate formed
Flame test Pale green colour
What is the most likely contaminant in the water?
(A) Ba 2+
(B) Ca 2+
(C) Cu 2+
(D) Fe 3+
2010 - Q20
Solutions containing copper ions were analysed by AAS. A standard solution of 10 ppm copper had an AAS absorbance of 0.400. A second solution of unknown concentration was found to have an absorbance of 0.500. 100 mL of this second solution was reacted with excess sodium carbonate solution. The precipitate was then dried and weighed. What mass of precipitate was formed?
(A) 1.25 × 10⁻³ g
(B) 2.43 × 10⁻³ g
(C) 1.54 g
(D) 2.43 g
2011 - Q10
An aqueous sample containing the following anions is analysed.

2012 - Q10
Samples of a solution of barium nitrate were independently tested with chloride ions, with sulfate ions and also for flame colour. Which row of the following table would represent the results?

2012 - Q20
All the lead ions present in a 50.0 mL solution were precipitated by reaction with excess chloride ions. The mass of the dried precipitate was 0.595 g.
What was the concentration of lead in the original solution?
(A) 8.87 g L–1
(B) 10.2 g L–1
(C) 11.9 g L–1
(D) 16.0 g L–1
2013 - Q2
What is the purpose of the flame in atomic absorption spectroscopy (AAS)?
(A) To ionise the sample
(B) To produce a spectrum
(C) To atomise the substance
(D) To provide the absorption wavelength
2015 - Q3
What flame colour do copper ions produce when heated?
(A) Brick red
(B) Blue-green
(C) Pale purple
(D) Yellow-orange
2015 - Q18 - 19
Use this information to answer Questions 18–19.
A sample of pond water from a contaminated site was analysed to determine the concentration of lead ions using the following procedure.
• A measuring cylinder was used to collect a 50 mL sample from the pond.
• The sample was placed in a clean dry beaker.
• 25.0 mL of 0.200 mol L−1 sodium chloride solution was added to the sample.
• The precipitate of lead(II) chloride that formed was filtered, dried and weighed. It had a mass of 0.13 g.
18 How could the reliability of the analysis of the pond water be improved?
(A) Analyse more samples from the same pond
(B) Use 50 mL of distilled water as a control sample
(C) Analyse samples from different ponds on the site
(D) Remove other contaminants from the sample before the analysis
19 What was the concentration of lead ions in the sample?
(A) 5.0 × 10⁻³ mol L−1
(B) 5.8 × 10⁻³ mol L−1
(C) 9.3 × 10⁻³ mol L−1
(D) 10.7 × 10⁻³ mol L−1
2016 - Q13
The flow chart shows the steps used to identify a sample of a substance.

If the substance is sodium sulfate, what should have been observed in Tests 1, 2 and 3?

2001 - Q26 (4 marks)
A university student decided to measure the concentration of lead (Pb) in the soil around his home. He prepared five standard lead solutions of known concentration. The absorbance of these solutions was measured. These results are shown in the table.
(a) Draw a line graph of these data. (1 mark)
(b) The student prepared solutions from four different soil samples around his home. These solutions were also analysed using the same method. The results are shown in the table.
Determine the highest concentration of lead in the soil sample around the home. (1 mark)
(c) State an hypothesis to account for the variation in lead concentration around the student's home. (2 marks)


2002 - Q24 (4 marks)
Assess the impact of atomic absorption spectroscopy (AAS) on the scientific understanding of the effects of trace elements.
2003 - Q27 (5 marks)
A student carried out an investigation to analyse the sulfate content of lawn fertiliser.
The student weighed out 1.0 g of fertiliser and dissolved it in water.
50 mL of 0.25 M barium chloride solution was then added.
A white precipitate of barium sulfate formed, which weighed 1.8 g.
(a) Calculate the percentage by mass of sulfate in the fertiliser. (2 marks)
(b) Evaluate the reliability of the experimental procedure used. (3 marks)
2004 - Q20 (6 marks)
A schematic figure of an atomic absorption spectrophotometer is shown.
(a) What is the purpose of the light source and the flame in the figure? (2 marks)
(b) Soil from an industrial site was suspected of being contaminated with mercury. A single sample of the soil was extracted using an approved method. The resulting solution was analysed five times by atomic absorption spectroscopy (AAS). The results are shown in the table.
Measurement # Absorbance (259nm)
1 0.90
2 0.89
3 0.89
4 0.64
5 0.91
The concentration of mercury in the soil sample was calculated using an average absorbance of 0.85.
Assess the validity and reliability of the concentration of mercury determined using this procedure. (4 marks)

2006 - Q25 (5 marks)
Atomic absorption spectroscopy was used to analyse a set of standard solutions of copper. The results are presented in the table.
Concentration of copper (ppm) Absorbance
0 0
5 0.20
10 0.39
15 0.52
20 0.64
25 0.77
(a) Draw an appropriate graph of the data. (2 marks)
(b) An analysis of two samples containing copper was then performed. The results are given in the table.
Sample Absorbance
1 0.44
2 0.90
Use your graph to estimate the concentration of copper present in the samples, and assess the validity of each of your estimates. (3 marks)
2006 - Q26 (4 marks)
The flow diagram shows a series of tests that can be used to identify carbonate, chloride and sulfate ions present in a sample.
(a) Identify the gas observed during Step 1. (1 mark)
(b) Explain why the analysis must be performed in the sequence given. (3 marks)

2007 - Q17 (4 marks)
Each of the four bottles contains one of the following solutions:
• barium nitrate
• hydrochloric acid
• lead nitrate
• sodium carbonate.
(a) Write a correctly balanced equation to represent the reaction between Solution 1 and Solution 2. (1 mark)
(b) Use the information to identify the four solutions. (2 marks)
Solution Identity
1
2
3
4
(c) Why would it be inappropriate to use flame tests to identify these solutions? (1 mark)

2008 - Q19 (5 marks)
A laboratory assesses the amount of zinc in dietary supplement tablets.
A chemist prepared 4 tablet samples for analysis by dissolving the tablets individually in 10% nitric acid. Each tablet solution was made up to a final volume of 100 mL. Five standard solutions of zinc were also prepared.
The absorbances of the standard and sample solutions were determined by atomic absorption spectroscopy at 213.9 nm.
The results are presented in the table.
(a) Plot a calibration curve for the standard zinc solutions on the grid. (3 marks)
(b) Using the mean absorbance of the tablet samples, calculate the mean amount of zinc per tablet in mg. (2 marks)

2009 - Q24 (5 marks)
Describe the principle of atomic absorption spectroscopy and its application in environmental monitoring. Include a diagram in your answer.
2010 - Q29 (6 marks)
The flowchart shown outlines the process used to determine the amount of sulfate present in a sample of lawn fertiliser.
(a) What assumptions were made and how do these affect the validity of this process? (3 marks)
(b) It was found that 4.25 g had a sulfate content of 35%. What is the mass of the dried precipitate at Step 4? Include a chemical equation in your answer. (3 marks)

2012 - Q32 (3 marks)
The mercury concentration of a certain fish species was determined by atomic absorption spectroscopy.
The sample data are:
Mass of fish (g) 18.6
Final sample volume (mL) 25.0
Absorbance (mean) 0.280
A consumer wants to avoid eating fish with a mercury concentration greater than 0.5 mg/kg of fish.
Calculate the concentration of mercury in the fish sample and state whether the consumer can eat this fish species.

2013 - Q22 (5 marks)
A solution contains three cations, Ba 2+ , Cu 2+ and Pb 2+ . The flow chart indicates the plan used to confirm the identity of these cations.
(a) Name Precipitate 2. (1 mark)
(b) Write a balanced net ionic equation for the formation of Precipitate 1. (2 marks)
(c) Suggest a test and the expected result that would confirm the identity of the metal cation remaining in Filtrate 2. (2 marks)

2016 - Q19
Excess barium nitrate solution is added to 200 mL of 0.200 mol L–1 sodium sulfate.
What is the mass of the solid formed?
(A) 4.65 g
(B) 8.69 g
(C) 9.33 g
(D) 31.5 g
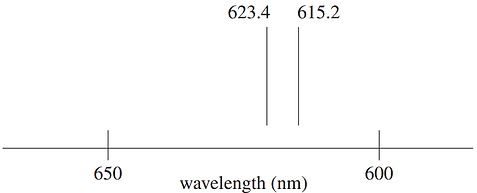
2016 - Q20
A section of the emission spectrum of a mercury lamp is shown.
Light at 623.4 nm and 615.2 nm from the mercury lamp was passed through a sample of water containing mercury, and the intensities were then measured by a detector.
I (x nm) = Intensity of light at a wavelength of x nm from the lamp
Id (x nm) = Intensity of light at a wavelength of x nm at the detector
Which of the following pairs of intensities can be used in the determination of the amount of mercury in the water sample using atomic absorption spectroscopy (AAS)?
(A) I (615.2 nm) and Id (615.2 nm)
(B) I (615.2 nm) and Id (623.4 nm)
(C) I (615.2 nm) and I (623.4 nm)
(D) Id (615.2 nm) and Id (623.4 nm)
2017 - Q2
Which row of the table correctly matches an ion with its flame colour during a flame test?

2017 - Q8
There are two unlabelled solutions. One is barium nitrate and the other lead nitrate.
Which of the following could be added to the two unlabelled solutions to distinguish between them?
(A) Sodium sulfate
(B) Sodium nitrate
(C) Sodium chloride
(D) Sodium carbonate
2013 - Q23 (7 marks)
A 20.72 g sample of solid lead was placed into 0.100 L of 1.00 mol L–1 silver nitrate solution.
(a) Complete the table. Show relevant calculations in the space below the table. (5 marks)
(b) With reference to only ONE species in the product mixture, explain why care must be taken in disposing of the final mixture. (2 marks)

2014 - Q24 (5 marks)
A solution contains carbonate, chloride and sulfate ions.
Describe a sequence of tests that could be used to confirm the presence of each of these ions. Include ONE relevant chemical equation.
2014 - Q27 (6 marks)
Limestone (CaCO3) contributes to the hardness of water by releasing Ca 2+ ions in water. The chemical equation for this exothermic reaction is shown.
CaCO3(s) + H2O(l) + CO2(g) <----> Ca 2+ (aq) + 2HCO3 − (aq)
(a) Explain why increasing the temperature of hard water would reduce its hardness. (2 marks)
(b) Describe how atomic absorption spectroscopy (AAS) could be used to measure the effectiveness of heating water to reduce its hardness. (4 marks)
2015 - Q29 (7 marks)
The procedure of a first-hand investigation conducted in a school laboratory to determine the percentage of sulfate in a lawn fertiliser is shown.
• 2.00 g of a sample of fertiliser was ground up and placed in a beaker.
• It was dissolved in about 200 mL of 0.1 mol L−1 hydrochloric acid, stirred and filtered.
• Excess barium chloride solution was quickly added to this beaker and a precipitate formed.
• The precipitate was then allowed to settle, filtered using filter paper and the residue collected.
• The residue was dried and weighed and had a mass of 2.23 g.
(a) Suggest modifications that could be made to the procedure to improve the results of this investigation. Justify your suggestions. (4 marks)
(b) Calculate the percentage of sulfate in the original fertiliser sample. (3 marks)