Barker College Chemistry Department
Past HSC Chemistry Questions
Please click the following link for the past papers of the new syllabus: HOME | Past Hsc Chem3 (andrewchoi2.wixsite.com)
2001 - Q11
Why is chlorine used to treat local water supplies?
(A) To make water suitable for swimming
(B) To kill micro-organisms living in the water
(C) To promote sedimentation of finely suspended solids
(D) To precipitate heavy metal ions such as lead and mercury
2001 - Q14
Which diagram represents the most effective design for a microscopic membrane filter to purify contaminated water?

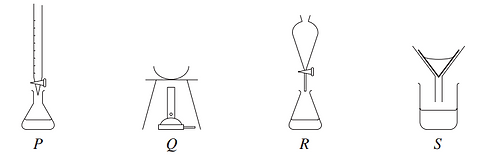
2003 - Q5
Which of the following could be used to determine the total dissolved solids in a sample of muddy river water?
(A) P and Q
(B) R and S
(C) P and R
(D) Q and S
2005 - Q12
A student performed a sampling technique as part of a first-hand investigation on water quality and repeated the sampling technique several times. What aspect of the experiment was improved by repeating the procedure?
(A) Accuracy
(B) Reliability
(C) Safety
(D) Validity
2005 - Q14
Water quality analyses were performed at different sites on a river shown on the map.


2005 - Q15
The Winkler method is used to determine the amount of dissolved oxygen in a sample. In this procedure, oxygen reacts with Mn2+ under alkaline conditions to produce a precipitate of MnO(OH)2.
2Mn2+ (aq) + O2(aq) + 4OH− (aq) → 2MnO(OH)2(s)
The precipitate is then dissolved in acid and reacted with iodide, forming iodine and Mn2+ .
MnO(OH)2(s) + 2Ι− (aq) + 4H+ (aq) → I2 (aq) + Mn2+ (aq) + 3H2O(aq)
Finally, the amount of iodine produced is determined by reaction with thiosulfate.
I2 (aq) + 2S2O3 2− (aq) → 2Ι− (aq) + S4O6 2− (aq)
When a sample of water was analysed using the Winkler method, a total of 0.60 mol of thiosulfate was used in the reaction.
How many moles of oxygen were present in the original sample?
(A) 0.15
(B) 0.30
(C) 0.60
(D) 1.20
2006 - Q13
Why are microscopic membrane filters useful for water purification?
(A) They can kill bacteria.
(B) They adjust the pH of water to 7.
(C) They are composed of biodegradable polymers.
(D) They can remove very small particles from water.
2007 - Q11
What is the consequence of having large concentrations of Mg 2+ and Ca 2+ ions in waterways?
(A) Turbidity
(B) Hardness
(C) Eutrophication
(D) Heavy metal contamination
2008 - Q12

2009 - Q11
The following process is used to purify water for drinking.

2009 - Q15
The graph shows the maximum dissolved oxygen concentration in water as a function of temperature at normal atmospheric pressure.
What is the volume of O2 that can dissolve in 10.0 L of water at 25°C and normal atmospheric pressure?
(A) 62.0 mL
(B) 63.5 mL
(C) 80.0 mL
(D) 124 mL

2010 - Q5
An imbalance of which two substances causes the eutrophication of waterways?
(A) H + and OH −
(B) Mg 2+ and Ca 2+
(C) Oxygen and ozone
(D) Phosphorus and nitrogen
2011 - Q5
Iron (III) chloride and aluminium sulphate are two chemicals that can be used in the purification of town water supplies.
What is the role of these chemicals?
(A) To disinfect water by removing bacteria
(B) To remove particulate material by flocculation
(C) To control the concentration of total dissolved solids
(D) To control the pH of the water within the required range
2012 - Q1
Which of the following is a measure of the clarity of water?
(A) Hardness
(B) Turbidity
(C) Total dissolved solids
(D) Biochemical oxygen demand
2014 - Q6
Drinking water is regularly tested to ensure that it is safe for consumption. Which of the following test results indicates the highest drinking-water quality?

2015 - Q15
Part of a water catchment is shown in the diagram.
A sample of river water taken from point X is analysed.
Which row of the table shows the most likely results?


2016 - Q2
Which of the following metal ions would NOT cause heavy metal pollution if released in high concentrations?
(A) Copper
(B) Lead
(C) Mercury
(D) Sodium
2016 - Q8
The following procedure was used to test water hardness.
• 5.0 mL of hard water was placed in a test tube.
• 0.1 mL of liquid soap was added to the test tube.
• The sample was shaken for 30 seconds.
• The height of bubbles was measured.
What would be a suitable control to use with this procedure?
(A) Not adding any soap to the test tube
(B) Not placing any water in the test tube
(C) Using a second sample of the hard water
(D) Replacing the hard water with distilled water
2002 - Q26 (5 marks)
Water can be described as either 'hard' or 'soft'.
(a) Describe a test you have used to determine whether a given sample of water is ‘hard’ or ‘soft’. (2 marks)
(b) A sample of hard water contains 6 × 10⁻⁴ mol L–1 of magnesium carbonate. Calculate the mass, in mg, of magnesium carbonate in 150 mL of this sample.
2002 - Q27 (5 marks)
Describe the physical and chemical processes needed to purify and sanitise a town water supply.
2003 - Q26 (4 marks)
Describe the process of eutrophication, and assess the suitability of water quality tests used to monitor it.
2003 - Q28 (4 marks)
The results of analysis of a set of standard cadmium solutions are presented in the table.
(a) Draw an appropriate graph of the data (2 marks)
(b) The map shows a catchment area. There is an industrial plant, a sewage treatment plant and a small town, all of which discharge water into the river. Water samples were collected at four sites.
The results of analysis of cadmium levels from these four sites are given in the table.
Justify your conclusion about the most likely source of cadmium pollution. (2 marks)


2004 - Q21 (7 marks)
You have performed first-hand investigations on water samples using qualitative and quantitative analyses.
(a) Distinguish between qualitative analysis and quantitative analysis. (2 marks)
(b) Describe TWO factors that affect the concentrations of ions in natural bodies of water. (2 marks)
(c) Complete the following table to show how the anions listed can be identified.

2005 - Q25 (6 marks)
A student collected a 500 mL sample of water from a local creek for analysis. It was filtered and the filtrate evaporated to dryness. The following data were collected.
Mass of filter paper 0.16 g
Mass of filter paper and solid 0.19 g
Mass of evaporating basin 45.33 g
Mass of basin and solid remaining 45.59 g
(a) Calculate the percentage of total dissolved solids in the creek sample. (2 marks)
(b) It is suspected that lead has contaminated the creek.
Describe a chemical test that could be carried out on the water sample to determine the presence of lead. (2 marks)
(c) The concentrations of ions in substances used by society need to be monitored. Justify this statement with reference to ONE ion you have studied. (2 marks)
2005 - Q26 (7 marks)
The map shows the catchment for a town water supply.
Describe TWO possible sources of contamination in this catchment, and assess methods that could be used for purifying the water before it reaches the town.

2007 - Q27 (8 marks)
The diagrams represent equipment used in an investigation to determine the chloride ion concentration in a water sample.
(a) Describe how you could, using the equipment in the diagram, determine the chloride ion concentration in a water sample. Include a balanced equation. (3 marks)
(b) If the volume of the water sample being tested is 50.0 mL and the mass of the dried precipitate obtained is 3.65 g, calculate the chloride ion concentration in the water sample in ppm. (3 marks)
(c) Why is it important to determine the chloride ion concentration in water? (2 marks)

2008 - Q17 (5 marks)
Using TWO examples, analyse how the features of catchment areas will determine the water treatment necessary to make the water safe to drink.
2009 - Q25 (7 marks)
An analytical chemist determined the phosphate concentration of water samples from three local streams.
(a) Using the absorbance values in the table and graph, determine the mean absorbance and mean phosphate concentration for each stream and complete the table. (2 marks)
(b) The recommended maximum level of phosphate in streams is 0.100 mg L–1 . With reference to the recommended maximum level of phosphate for stream 3 2 water, explain why there are differences between the three streams. (3 marks)
(c) Why is phosphate concentration a water quality issue? (1 mark)

2010 - Q25 (5 marks)
What is the relationship between dissolved oxygen and biochemical oxygen demand and why is it important to monitor both in natural waterways?
2010 - Q31 (6 marks)
(a) A student collected a 250 mL sample of water from a local dam for analysis. The data collected are shown in the table.
Mass of filter paper 0.23 g
Mass of filter paper and solid 0.47 g
Mass of evaporating basin 43.53 g
Mass of basin and solid remaining 44.67 g
(i) The water was filtered and the filtrate evaporated to dryness. Calculate the percentage of the total dissolved solids in the dam sample. (2 marks)
(ii) It is suspected that the water in the dam has a high concentration of chloride ions. Describe a chemical test that could be carried out on the water sample to determine the presence of chloride ions. Include an equation in your answer. (2 mark)
(b) Name an ion other than chloride that commonly pollutes waterways, and identify its source and the effect of its presence on water quality. (2 marks)
2011 - Q28 (4 marks)
A student investigating the water quality of stormwater in a drain near the school collected samples for testing in the school laboratory. The student conducted the following tests to measure the quality of the stormwater.
• Hardness • Total dissolved solids • Phosphate level
• Turbidity • Biochemical oxygen demand • Nitrate level
For TWO of these tests, outline the chemical or physical principle involved and the procedure followed in a school laboratory.
2011 - Q31 (4 marks)
A council monitors the water quality of a local river daily. The records for six days are shown in the table. During this period contamination from unknown sources was detected.
Propose possible sources of the contamination, justifying your answer with reference to the data provided.

2012 - Q25 (3 marks)
Describe the process of monitoring waterways for eutrophication.
2013 - Q26 (4 marks)
Explain how microscopic membrane filters purify contaminated waters, in terms of their design and composition.
2014 - Q23 (3 marks)
This diagram shows a town situated near agriculture and industry.
The town relies on the river for its water supply.
(a) Identify ONE chemical species that could be a contaminant of the water supply. (1 mark)
(b) Explain the need to monitor the levels of a contaminant in water supplies. (2 marks)

2016 - Q24 (7 marks)
(a) Explain how microscopic membrane filters are used to purify contaminated water. Use a labelled diagram to support your answer. (4 marks)
(b) Explain why dissolved oxygen levels can be used to measure the extent of eutrophication. (3 marks)